

FireWorks Business Intelligence (BI) And Analytics Tools Can Now Be Used Directly On Your First Arriving Dashboards. Once Your Reports And Views Have Been Created And Published, They Can Be Added As Additional Items That Rotate On Your Dashboard Content Loop!
Example Reports:
- Pre Incident Plans
- By Month (Overdue)
- By Current Fiscal Year (Overdue)
- Incidents by Stations (Current Year)
- Broken down by shift and/or station
- Good Intent / Hazardous calls
- Can be displayed as Pie Chart
- Current Unit Status
- Pie chart showing fleet status
- Number of In-Service units
- Number of Out of Service units
- Number of In Reserve units
- Pie chart showing fleet status
- Apparatus Incidents by Part of Day (This Year)
- Bar graph showing how many calls each unit has responded to
- Analysis by Incident Type (This Year)
- Pie Charts that break down your types of calls year to date
- Includes Hazardous as well as Good Intent calls
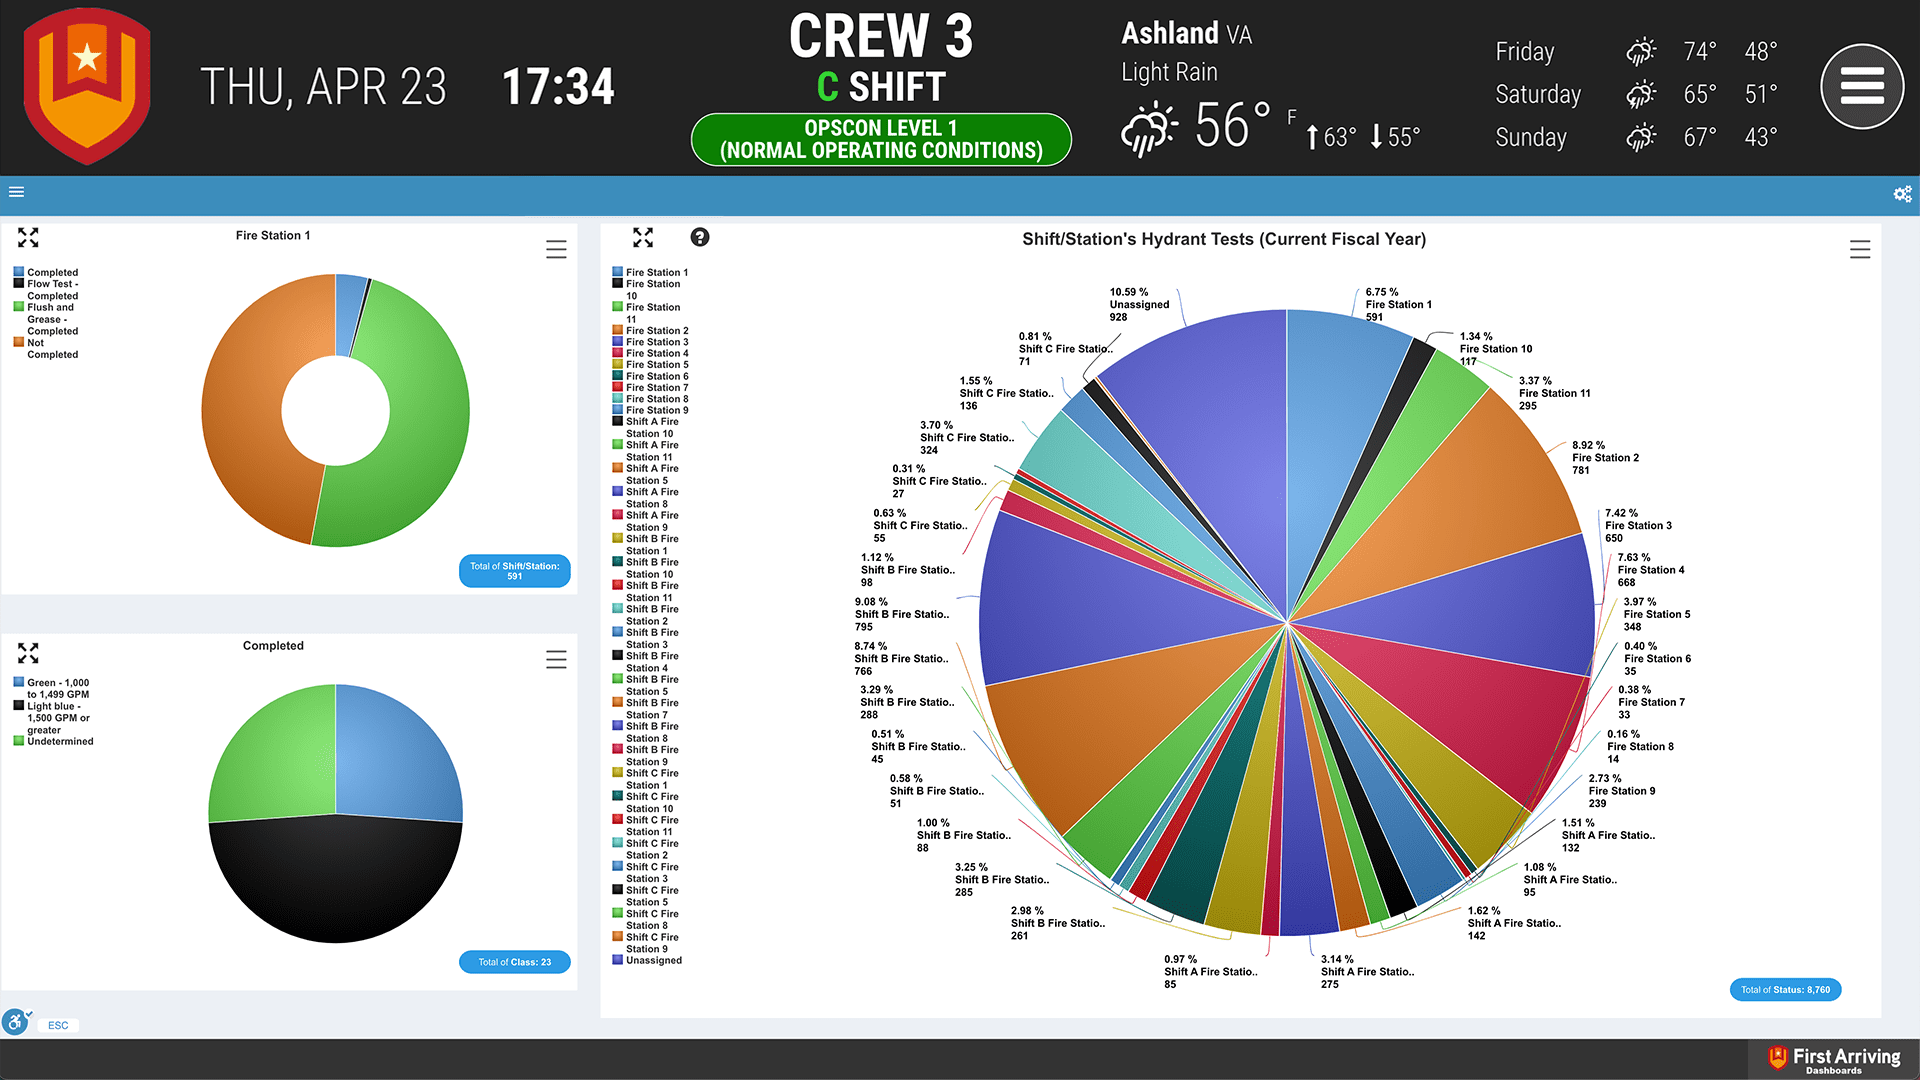
- Shift/Station Hydrant Test Completions
- Pie Charts that break down your types of calls year to date
- Pie Chart showing number assigned to station and shift
- Types of tests that need to be completed, such as flow, flush, and grease
- Open NFIRS Reports (All Dates)
- Pie Charts showing Draft as well as Reopened reports
- Year to Year comparisons of total dispatches
- Bar Graph showing number of calls year after year
- 90th Percentile Apparatus Turnout Time
- Bar Graph showing unit name and time compared to rest of fleet
- 90th Percentile Apparatus Response Time
- Bar Graph showing unit name and time compared to rest of fleet
What We Need:
- Fireworks Account And Access To The BI & ISO Reporting Tools
- Create The Report You Wish To Display On The Dashboard And Publish
- Provide Us The Unique URL That Is Generated To Dashboards@Firstarriving.Com
- Please note that Data / API access could be an additional charge by the vendor. This is determined by the vendor and not by First Arriving.


